365 DAYS OF COLOR:
CREATING A PERSONAL DATAVIZ PROJECT
Article published in the Journal of Natural Science Illustration, volume 55, number 1
published by the Guild of Natural Science Illustrators (GNSI).
published by the Guild of Natural Science Illustrators (GNSI).
/ INTRO
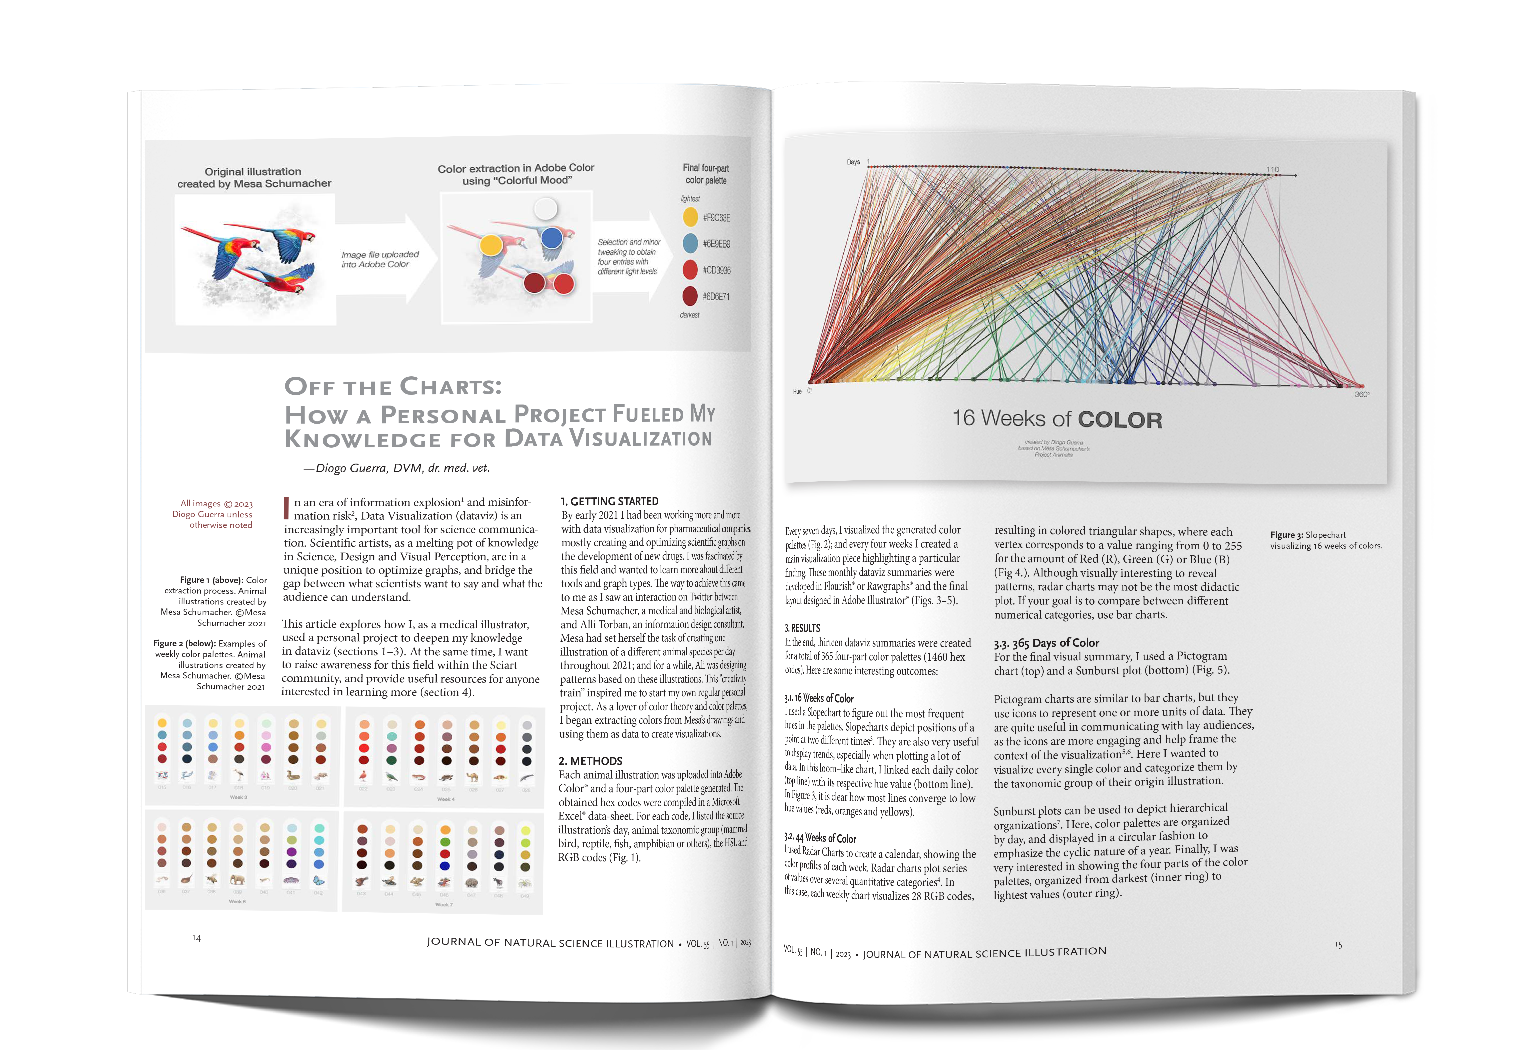
In an era of information explosion and misinformation risk, Data Visualization (dataviz) is an increasingly important tool for science communication. Scientific artists, as a melting pot of knowledge
in Science, Design and Visual Perception, are in a unique position to optimize graphs, and bridge the gap between what scientists want to say and what the audience can understand.
This article explores how I, as a medical illustrator, used a personal project to deepen my knowledge in dataviz. At the same time, I want to raise awareness for this field within the Sciart community, and provide useful resources for anyone interested in learning.
⇢ Guerra, D. (2023). Off the Charts: How a Personal Project Fueled My Knowledge for Data Visualization. Journal of Natural Science Illustration, 55(1), 14–17.
Updated April 2023
© Diogo Guerra. 2023